N ways to debug React Native app
React Native is an abstraction over the native code, which allows us to have one code base for multiple platforms. Sounds great, right? Not everybody though is so enthusiastic about this approach. One of the reasons might be troublesome running and debugging the JavaScript code. In this blog post you may find a short tutorial on how to debug your app on Android and iOS, on a physical device or a simulator/emulator, the JavaScript code and the native one.

Run the iOS app
It is quite convenient to create build configurations in your IDE. I personally use IntelliJ IDEA, but WebStorm is pretty similar.
Go to Add Configuration (or Edit configuration, if you happen to have any configuration created already).


Add a new React Native configuration.

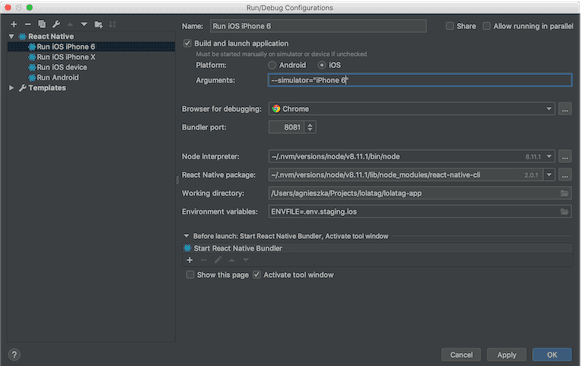
Call it Run iOS or whatever is meaningful to you. As a Target Platform choose iOS. We can use either a physical device or a simulator to run the app on.
- To install the app on a physical device set
Argumentsproperty to--device="MyDevice". The name of your device you can find and edit inSettings->General->About->Name. - To install and run the app on a simulator set
Argumentsproperty to--simulator="iPhone X"(or any other device with iOS you want to test on). The simulator is shipped with Xcode and you need a Mac to run it. To manage simulated devices, open Xcode, go toWindow->Devices and Simulators. - If you leave the
Argumentsproperty empty, it will attempt to install the app on any connected device.
You can also include your .env file in the Environment property as follows: ENVFILE=.env.staging.
Run the Android app
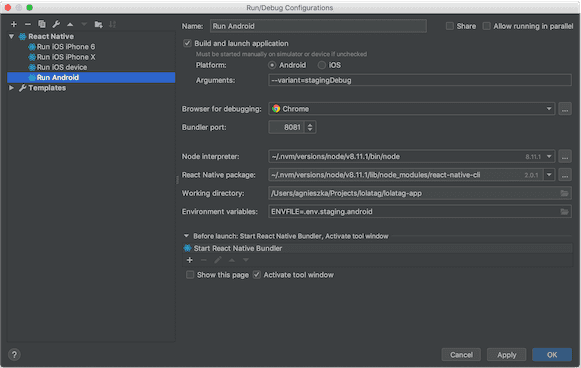
Creating the run configuration for Android is pretty similar. Add another React Native configuration, give it a name and choose Android as a Target Platform. To run the app on a device or a simulator, you need to have adb installed. It is shipped with Android Studio, which is convenient to have installed anyway. To view and manage Android emulated devices, you may use Android Studio. From menu select Tools -> AVD Manager. You can also use the command line for this, check the details here. To run the app on a physical device, you need to enable the developer mode on it. Once you run the app, it will be installed on all devices connected (to view the devices list, you can run adb devices).
Hot Reloading
Now that we can run the React Native app, there is a handy option, you may want to enable: Hot Reloading. To enable it, open the in-app developer menu with CMD + D (iPhone simulator), or CMD + M (Android emulator), or shake gesture (physical device).
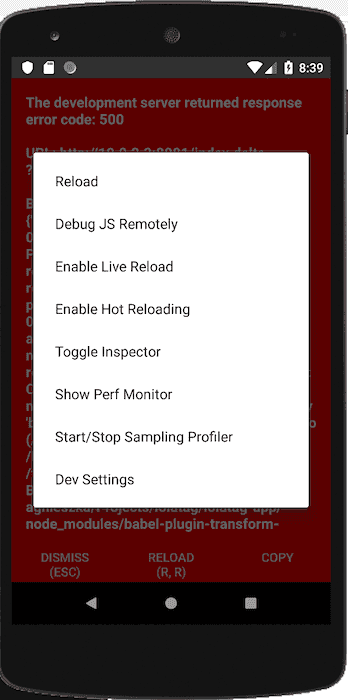
Hot reloading will reflect any changes you make in the JavaScript code right away in the running app. This means you won’t need to reload your app. There is also another option available: Live reload. It will reload your app anytime you change the code, which means you will lose the current app state.
Inspector
Once we are in the developer menu, there is another useful option - inspector. This is not the fully featured inspector a web developer may know from web browsers, but it may help from time to time. To enable it, choose Toggle Inspector.
Debug JavaScript code
Now we are almost ready to debug the JavaScript code. Put some breakpoints and run debug. Once the app launches on your device, enter the in-app developer menu and choose Debug JS Remotely. A web browser should open and display the debugger page. If it does not, open in manually. Now you can debug your JS code either in the browser’s developer tool window or via the IDE. You can debug your app both on physical and virtual devices, on Android and iOS.
Debug native code
While developing a React Native app, most often you are focused on the JavaScript code, but you cannot forget that the native code is still there under the hood. Sooner or later, you will probably need to dive deep into it. Here is the way how to debug the native code inside a React Native app.
- Run your React Native app (on a device or an emulator/simulator).
- Open the native subproject of your React Native app (probably placed in
androidoriosdirectory) in Android Studio or Xcode. - Attach to the process:
In Android Studio open
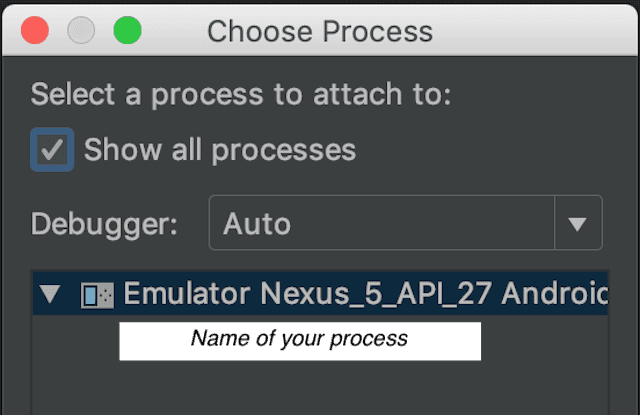
Attach debugger to Android process, checkShow all processesand choose the device that your app is running on.
 In Xcode open
 Debug->Attach to Processand choose your app process (it will likely be named as your app).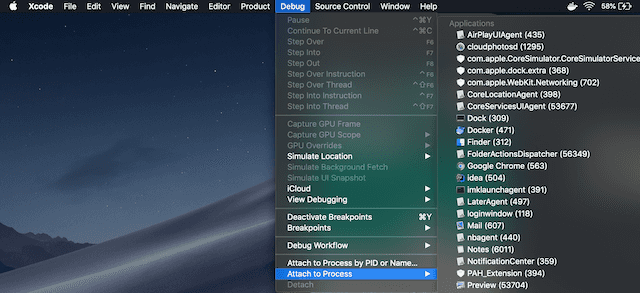
- Now you can debug the native code - the app code itself (which is probably not that necessary) as well as included libraries. The latter is extremely useful when you need to develop your own react-native-to-native bridge library.
Tips and tricks
Although it looks promising, not everything works like a charm. In fact, as of my experience, more often it does not work. Here are some tips, what to do when things don’t go like clockwork.
Hot reloading does not always reload a screen properly, sometimes you just need to reload the app manually to get the changes visible (especially when you change the styles only). Keep it in mind, when your changes don’t seem to work :)
While debugging JavaScript code, you may also encounter some problems. Just to name a few most often for me:
- sometimes the IDE decides to stop debugging :) Usually, it’s still possible to debug in the browser
- a breakpoint added while debugging does not take effect, even after reloading the app
- any changes made in the code while debugging do not take effect,
- the app crashes right after starting.
You can resolve most of these problems by taking one or more of the following steps: reopening simulator/emulator, reopening the browser, restarting the Metro Bundler process and the platform-specific process (or killing the node process), cleaning (remove node_modules directory and run yarn/npm install, remove ios/buid directory) and rebuilding the app.
To sum up, the JavaScript debugging process is not as seamless and stable as you may be used to if you come from native technologies, but you still can and should benefit from the mentioned possibilities and techniques.
