Performance testing in Postman
Performance testing is a great way to find out how stable, fast and reliable our application or site is. Evaluating responsiveness, defining possible bottlenecks and checking how the software handles the expected (and more importantly, the unexpected) errors are integral parts of quality assurance. When I discuss performance testing, the usual suggestions I hear are Jmeter, LoadNinja, Gatling etc. And while I consider all of the aforementioned very good shouts, there is sometimes a need to run performance tests immediately, without researching solutions, coding and training testers to use cumbersome tools. On numerous occasions, I have found Postman to be the remedy to such a problem.
Types of tests
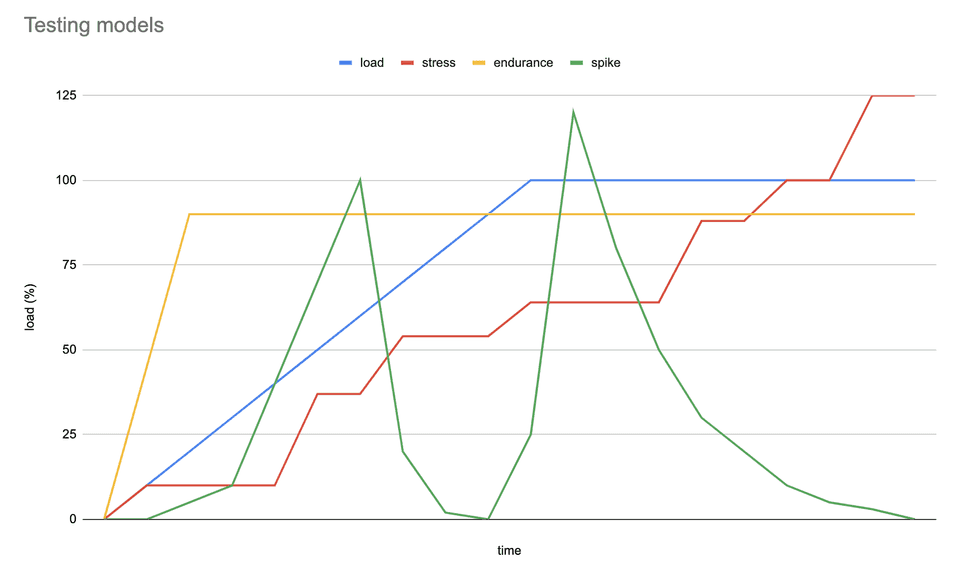
While there are multiple approaches in performance testing, we can divide all of them into a couple of models. Each model has its own goal and has to be adjusted so that the end product is always valuable and informative.
Load testing
Let’s imagine we have a certain limit - for example of customers being able to load our landing page. We want to check how the system handles reaching that limit. We call that load testing and it allows us to monitor the response time and, effectively, the time that customers will have to wait to use our software. A modified version of load testing is endurance or volume testing that basically means reaching the predefined limit and then observing how long our app can withstand the provided conditions.
Stress testing
Another type of performance testing is stress testing - when we gradually increase the load until it reaches the level we know the app will not handle. Seemingly harsh, it provides measurements about when the software fails, how it handles the inevitable errors, how it communicates being beyond the bandwidth capacity and last but not least, how it recovers.
Spike testing
Spike testing is a subtype of stress testing that focuses on the performance of the app under huge load volumes in a short period. Those ‘spikes’ should be created either between periods of usual production load (imitating the production environment) or no load at all.
All types of testing help in defining problems and effectively, improving the quality of the end product. The essential task is to adjust the type of testing used to the questions we want to answer.
Constant rush
In all the projects I’ve been and am involved in, more often than not, time is key. Whether it is a deadline, fixing an urgent bug, a downtime or something else, the QA department has to be in charge of keeping watch over the quality of the software and react quickly. The time constraints sometimes force us to prioritize tasks accordingly and choose tools enabling us to tackle them quickly. Postman is an easy, lightweight, and user-friendly platform generally associated with testing and developing the API. Also, given you already have your collections created and updated daily, you can run basic performance tests in a couple of minutes.
1. Setup
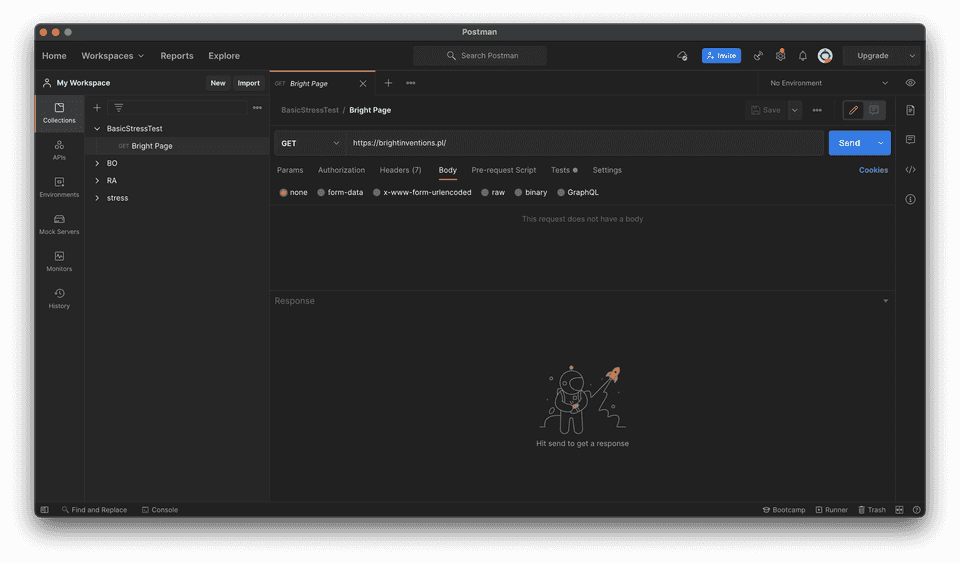
Create a collection and add the API calls you want to test. We’ll use Bright Invention’s main page in our simple example. Set the HTTP method to GET, type in the URL, click ‘Send’ and voilà la! The response shows the HTML structure of the tested page and Postman allows to visualise it.
2. Randomness
In some cases, we also have to add random data to our URL, body of the request etc. In order to avoid spamming with the very same call, randomize it, using the dynamic variables provided by Postman (e. g. {{$randomAlphaNumeric}}). Another good option is to load data from a JSON or CSV file creating a data variable in every iteration based on the next array/line. We don’t need this step in our example, though.
3. Acceptance criteria
To actually test, create an assertion that checks the response after every call. To do that, go to the Tests tab in the request edit view. We will add 3 basic tests: 200 status test, response time being under 400 ms, the response containing a certain string.
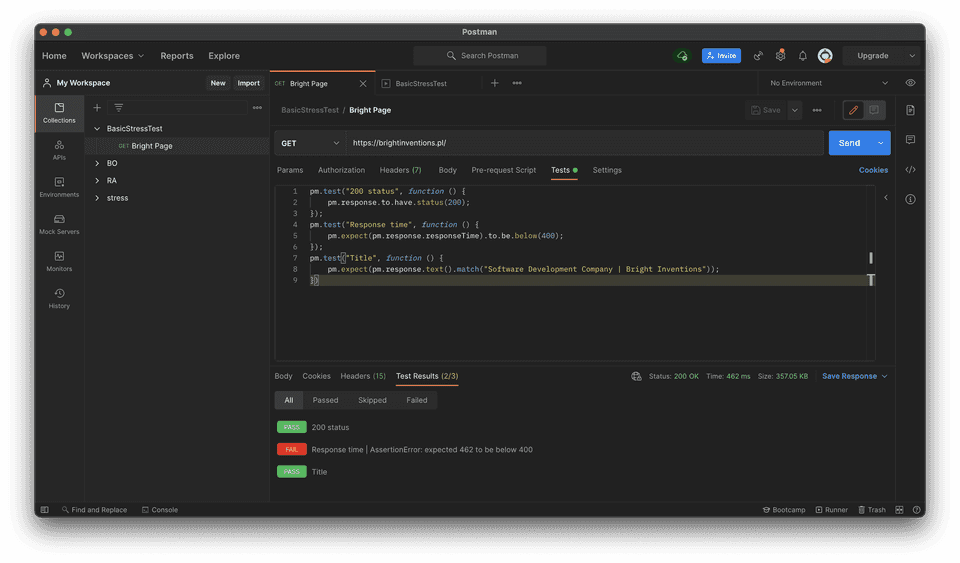
In the first test, the status code should always be equal to 200 as our page should (obviously) be available at any given time. The second test checks if the response is received in under 400 ms (which is strict, I admit) and the third one checks if the HTML received in the response contains "Software Development Company | Bright Inventions" text. After sending the request, apart from the response, we can also check the test results. In my example, the first and third tests passed with flying colours but the second one failed due to the time exceeding the predefined threshold.
4. Open the test runner
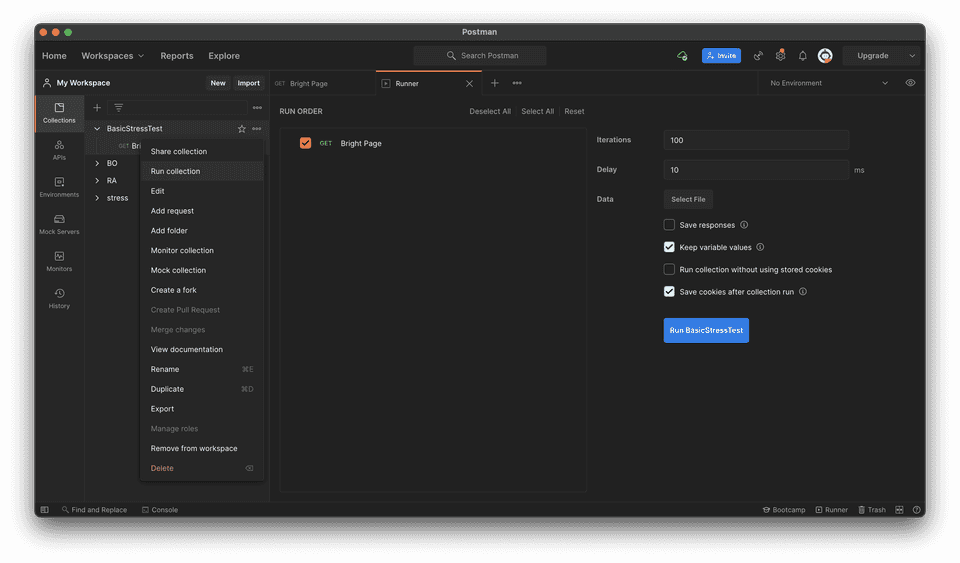
How to turn the basic checkup of one response into a performance test? Simply pick the “Run collection” option. You can choose the number of iterations, delay between the iterations and also import the data file if needed. Postman allows picking only the requests that have to be run while omitting the rest.
5. Run, Forrest!
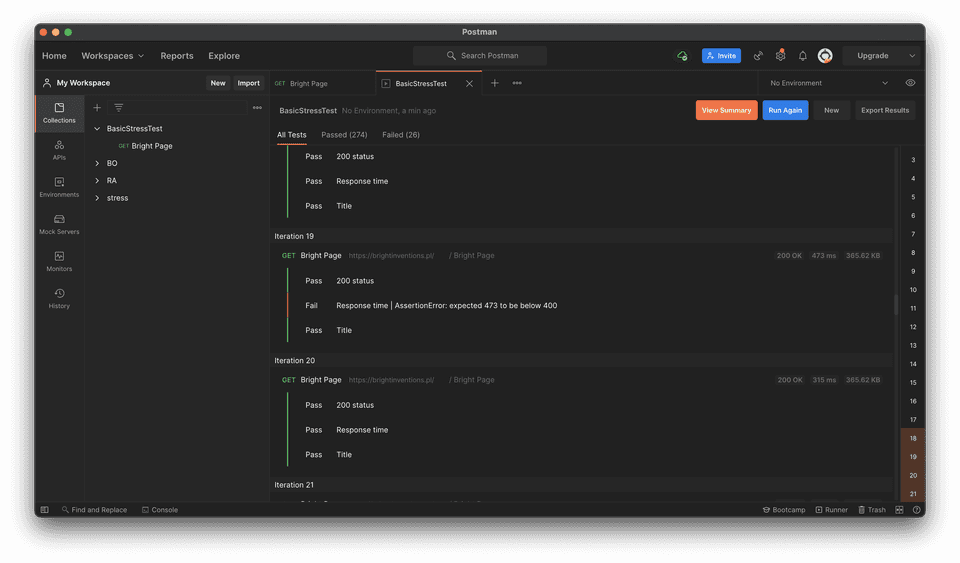
And now - we wait… The iterations count was set to 100 so it shouldn’t take long. After under a minute we have our results:
6. Analyzing results
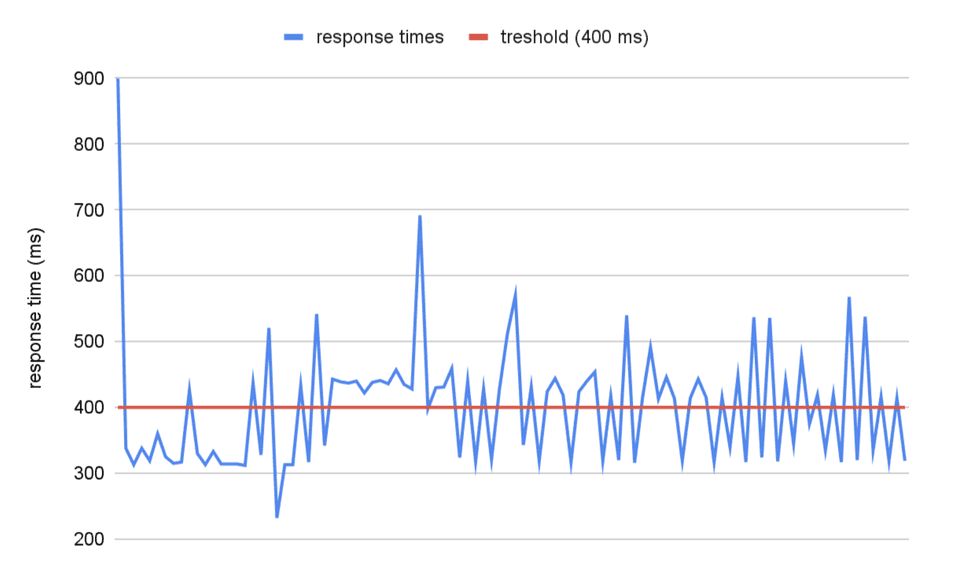
We can see that out of 300 tests, some failed. All of the failed ones were the response time tests and we can see how the response took longer and longer to be received over time - and it only took us 100 iterations! The graph created based on the exported result shows that over time, exceeding the limit of 400 ms happens more often and that there are occasional spikes when the response is received after 500-600 ms.
What’s next?
Obviously, Postman has limitations but it’s impressive that you can go from nothing to an easy performance test in minutes. To customize the tests you can add more requests, randomize them, create new tests and pre-request scripts. Experiment with the iterations number and the delay between them to recreate conditions similar to the real environment.
I recommend always considering the easy, convenient solution before trying the cumbersome, time-consuming options. It may turn out to be exactly what you need!
get free ebook about app security

