Microsoft Clarity for Web & Mobile Development: Benefits, Challenges, and Alternatives
Users rarely have time to give you feedback – so it's up to you to uncover insights yourself. This article explores how Microsoft Clarity can help you better understand user behavior through tools like heatmaps and session recordings. It also compares Clarity with other popular analytics solutions such as Hotjar and PostHog. Let’s dive in!

Microsoft Clarity Pricing
This tool has emerged as a hot must-have in analytics, especially among marketing specialists, thanks to the fact that Microsoft Clarity is free to use. Naturally, when something is free, it often means that our data becomes the product – and Microsoft is transparent about this on their website:
Clarity is built by Microsoft, one of the largest technology companies in the world. Microsoft processes a massive amount of anonymous data around user behavior to gain insights and improve machine learning models that power many of our products and services. Clarity is one of the ways Microsoft gathers this important data—and why we've made it available for free.
Before adding the Clarity script to your website, web app, or mobile application, it’s essential to review Microsoft Clarity privacy policy. This is critical if you represent sensitive sectors such as banking, government, or healthcare, where sharing user data with a third-party service may not be acceptable.
Microsoft Clarity Features
That’s all for the disclaimers – let’s now discuss what Clarity actually offers. Clarity is widely used for website analytics, but it can also be used to analyze web and mobile applications. It supports Android, iOS, React Native apps, and Microsoft has just announced that the Clarity Flutter SDK is now available to everyone as well, following the completion of beta testing.
Session Recording
You can watch your users’ sessions to identify issues such as:
- Dead clicks – when users click on something that isn’t clickable. This usually indicates a design issue where an element appears interactive but isn’t.
- Rage clicks – when a user clicks repeatedly on an element out of frustration. This typically means the element doesn’t work, is too slow to respond, or gives no feedback.
- Roadblocks – anything that prevents users from reaching a goal you’ve defined – such as submitting a form.
Heatmaps
Microsoft Clarity’s heatmaps are a type of report that allows you to generate visual insights based on filtered categories of users visiting specific pages. These heatmaps help you understand how users interact with your site or app. For example, you can analyze:
- Most-clicked or tapped areas – see which elements attract the most interaction.
- Attention hotspots – discover where users focus their attention. Interestingly, this isn’t always the area above the fold.
- Scrolling behavior – measure how far users scroll.
How to use Microsoft Clarity in software Development
Testing and debugging
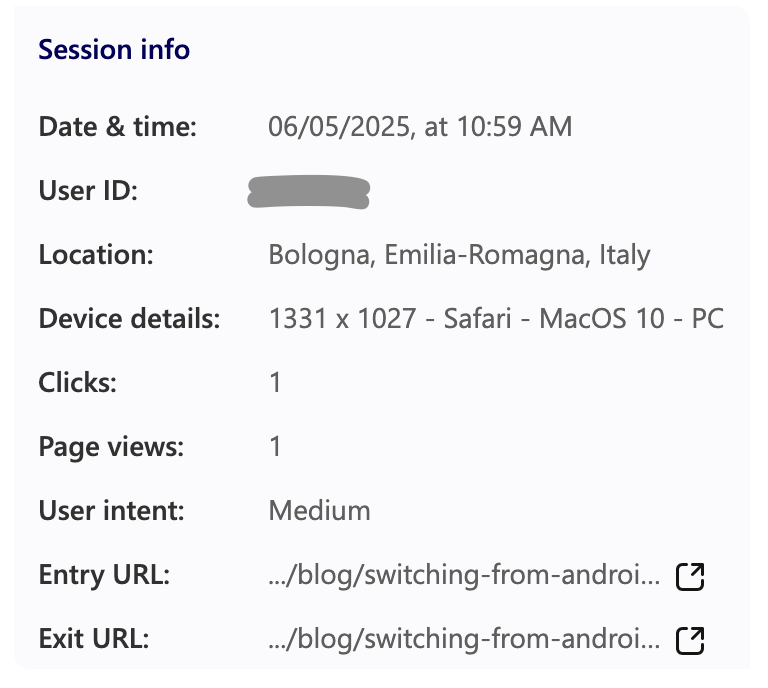
Clarity helps you reproduce bugs quickly by letting you watch exactly what happened. It also provides useful technical details such as device specifications, browser type, and screen resolution.
Example of information about the user:

Getting user feedback without engaging them directly
Users in industries like healthcare, transportation, and retail are often too busy to provide valuable feedback. That’s where Clarity comes in – you can gain insight into their behavior without interrupting their workflow. For example, you might observe users visiting a new feature screen but not interacting with it – a signal that something may need adjustment.
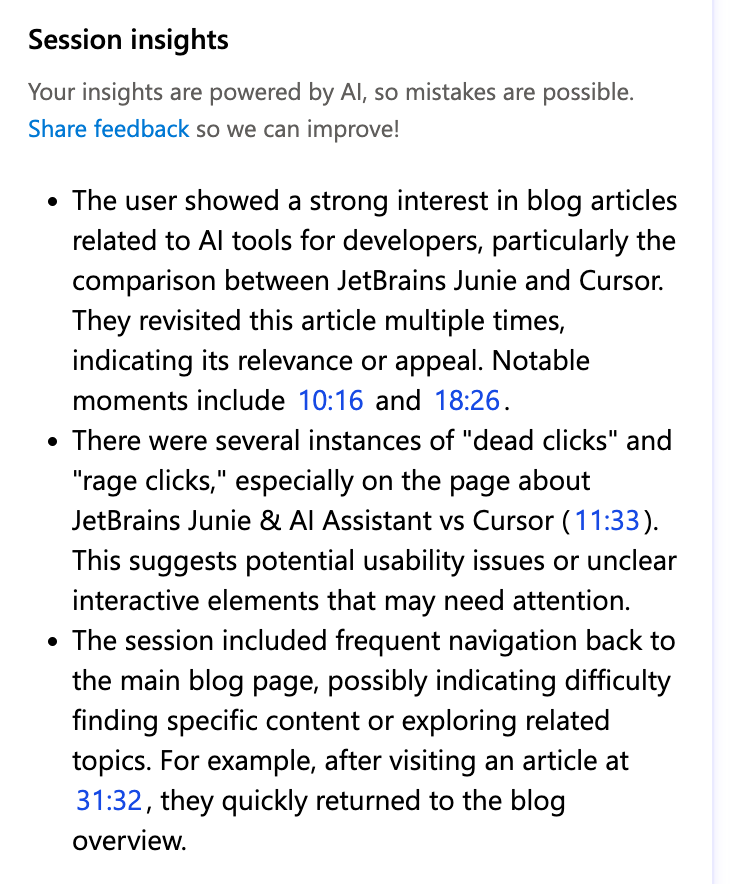
Here’s an example of an insight generated by Clarity’s AI from one of our blog user sessions:

AI summaries are especially useful when you need to extract insights from hundreds of session recordings. Usually, collecting data is the easy part – but finding the time to analyze it is the real challenge.
Legacy software modernization and redesign
Clarity is highly effective when modernizing or redesigning legacy software. It helps you identify ways to make key features more user-friendly and efficient – which is especially important for solutions used daily by frontline workers, such as custom point-of-sale systems, transport management software, or electronic health record platforms.
During the redesign process, Clarity allows you to spot patterns in how users interact with existing features – patterns worth preserving – as well as roadblocks and frustration points that should be eliminated in the modernized version.
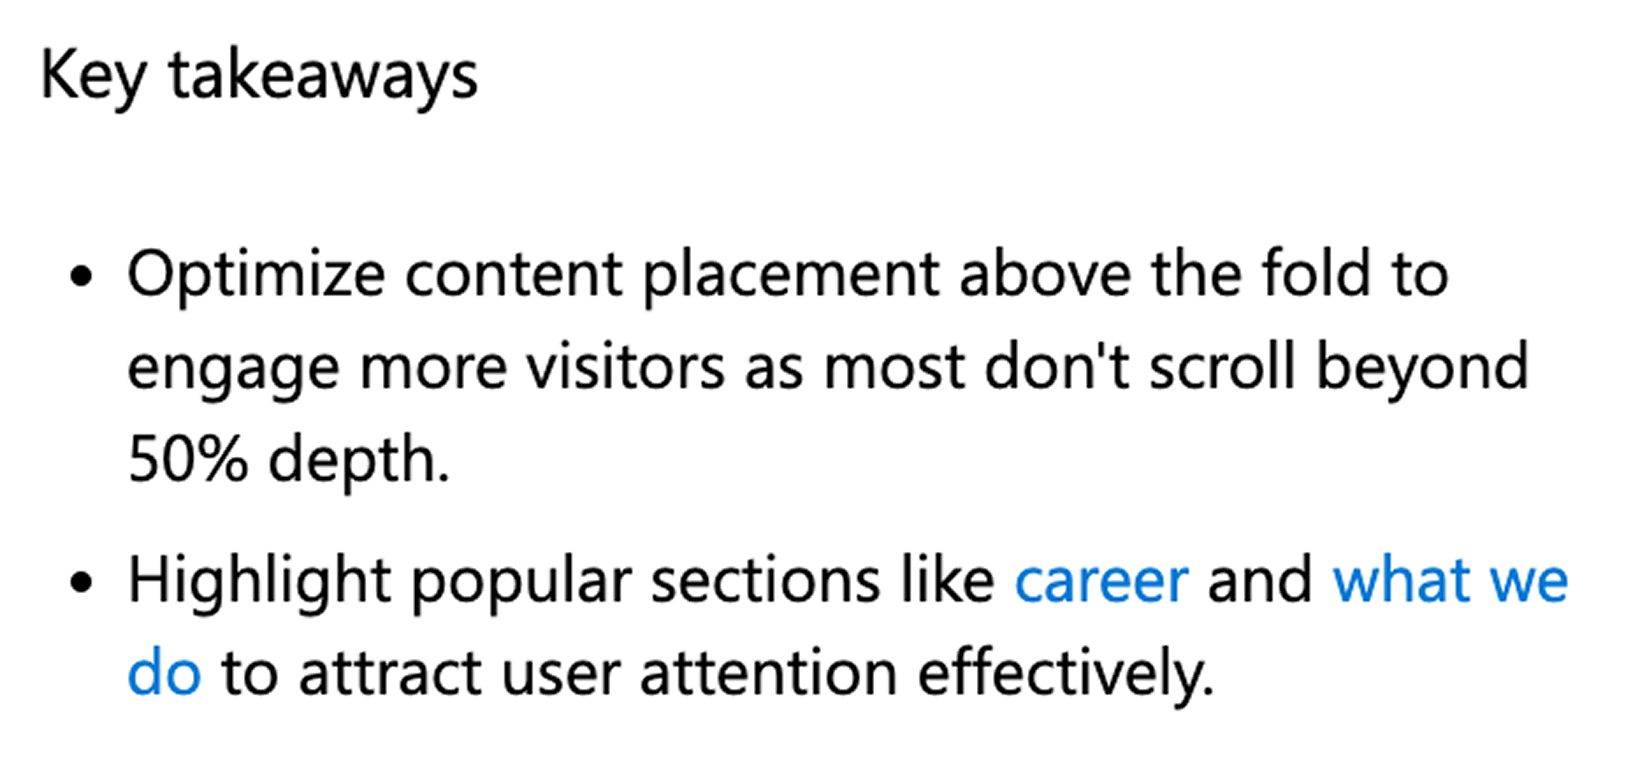
For example, Clarity can help you identify which sections of your page attract the most user attention. During a redesign, this insight helps ensure you maintain focus on those high-impact areas – as long as they naturally align with your goals for that specific page. Here's an example of key takeaways for a website:

Does Microsoft Clarity slow down your website or apps
There’s no clear-cut answer to this question – any additional script has the potential to impact your website or web app’s performance. The best way to know the actual effect is to measure your performance metrics before and after implementing the Clarity script.
A particularly important consideration is using Clarity in mobile applications. Based on our experience, the impact can vary. In some projects, we observed performance issues – especially on older mobile devices – while in others, there were no complaints or signs of degradation. That’s why it's essential to follow a test-and-measure approach.
Implement and test performance as early as possible. Testing in a staging environment is recommended, but it might not expose all edge cases. If performance issues arise – for instance, on older Android devices – you can re-configure the Clarity script. You have the option to adjust the snippet so it fires only on specific devices or operating systems. You can also fire it temporarily – for example, shortly after launching a crucial feature to observe user behavior.
Microsoft Clarity alternatives
No tool is perfect, so our team at Bright Inventions enjoys testing various solutions to find the one that gives the most value for a certain business and domain. Check out these Microsoft Clarity alternatives.
Microsoft Clarity vs Hotjar
Session recording and heatmaps are the core features of a quite popular tool – Hotjar (but free plan is limited). Explore main key differences and similarities between both tools.
| Feature | Microsoft Clarity | Hotjar |
|---|---|---|
| Pricing | Free (but you pay with your data) | Free plan with limited features; paid plans start at ~$39/month |
| Session Recordings | Yes – unlimited recordings | Yes – limited by plan |
| Heatmaps | Yes – includes click, scroll, and attention heatmaps | Yes – includes click, move, and scroll heatmaps |
| User Filtering | Yes – strong filtering and segmentation options | Yes – advanced options available on higher-tier plans |
| Surveys/Feedback | No | Yes – includes feedback widgets and surveys |
| Privacy & Data Usage | Data is used by Microsoft for machine learning – requires disclosure to end users | GDPR/CCPA compliant – more privacy-focused, especially on paid plans |
| Mobile App Support | Yes – supports web apps, native apps (Android/iOS), React Native; Flutter in beta testing | Limited – mostly for websites and web apps |
| Performance Impact | Lightweight script, but testing is recommended – particularly on mobile | Slightly heavier script; potential performance impact on large or complex websites |
Microsoft Clarity vs Posthog
If you're concerned about your app's performance – or already know that Clarity affects its speed – consider using PostHog for its Wireframe Mode feature.
This is how PostHog describes their solution:
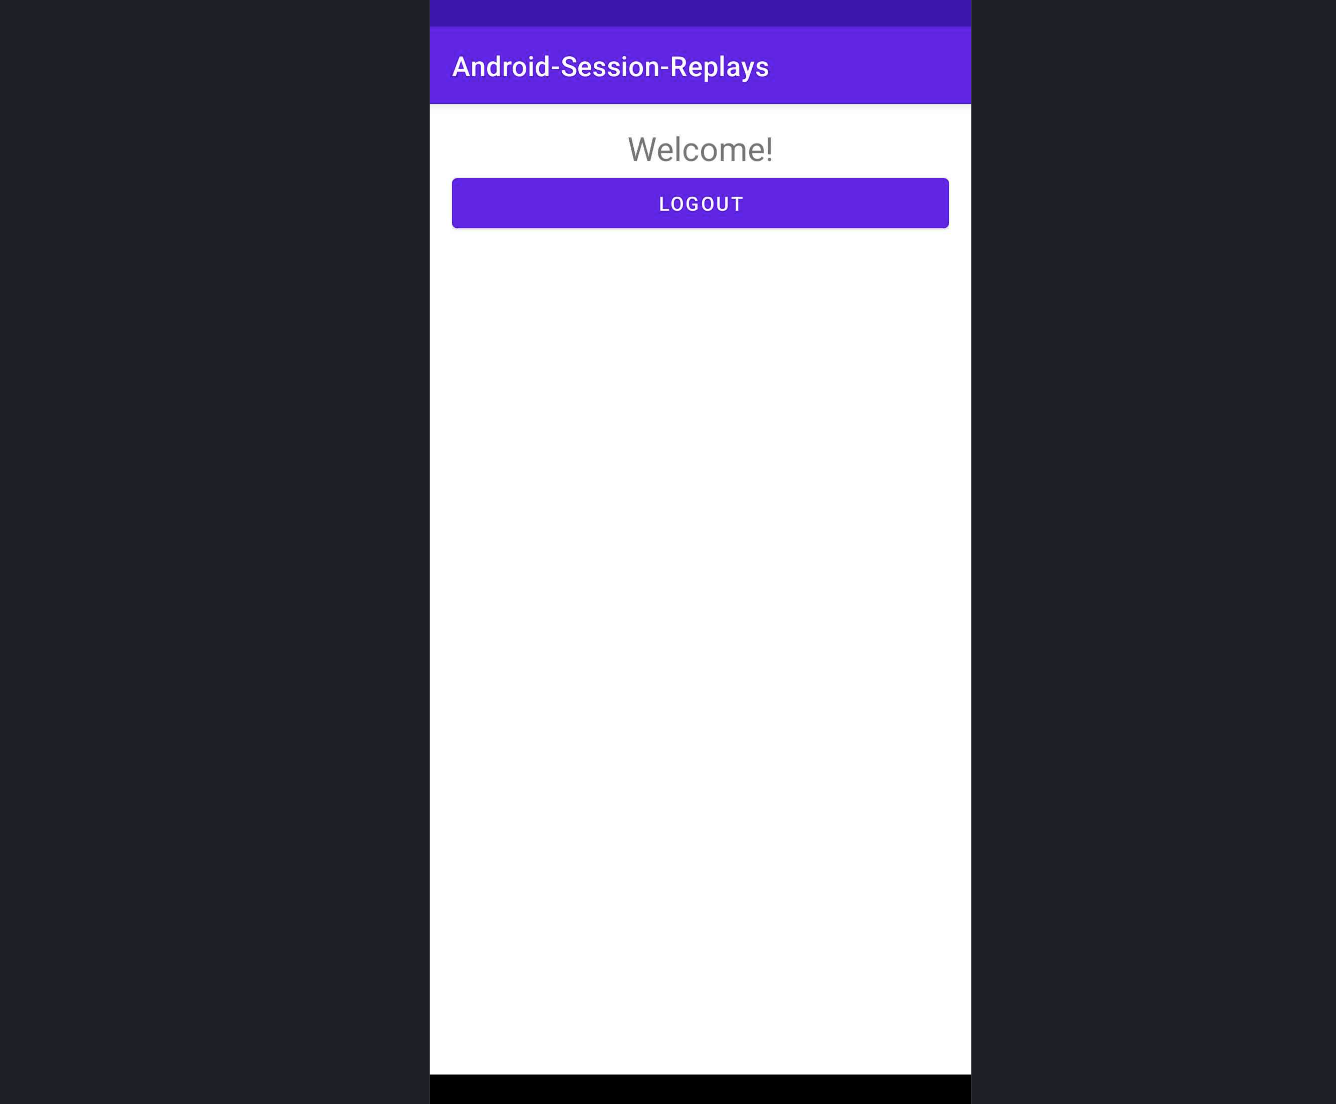
The view hierarchy is transformed to a JSON data structure and later rendered as an HTML wireframe. Since it is a wireframe, the UI won't have the original look and feel but it should be close enough to understand the user's behavior.
Below is an example of a screen captured in wireframe mode in Android:

Source: posthog.com/docs
And here’s a detailed Microsoft Clarity vs PostHog comparison:
| Feature | Microsoft Clarity | PostHog |
|---|---|---|
| Pricing | Free | Free tier (up to 1M events/month), with paid plans for higher volume and advanced features |
| Session Recordings | Yes – unlimited and automatic | Yes – with advanced options like Wireframe Mode for better performance on mobile |
| Heatmaps | Yes – click, scroll, and attention heatmaps | Yes – clickmaps and scrollmaps |
| User Interaction Data | Rage clicks, dead clicks, scroll depth, session filters | Clicks, hovers, session replays, funnels, retention, and custom events |
| Wireframe Mode | Not available | Yes – drastically reduces load during mobile session recording by using JSON-based wireframes |
| Mobile App Support | Web and mobile web; limited native mobile support (React Native, Flutter beta) | Full support – Android, iOS, React Native, and Flutter (with performance-optimized recording) |
| Privacy & Data Control | Data sent to Microsoft and used for machine learning | Self-hosted or cloud – full control of your data (ideal for privacy-conscious orgs) |
| Integrations | Growing number of integrated solutions e.g. GA4, Zapier, HubSpot, Firebase. | Wide plugin system, API access, and integrations with tools like GitHub, Segment, Zapier |
| Custom Reporting | Limited – prebuilt behavior-focused reports | Extensive – customizable dashboards, SQL-like queries (HogQL), and advanced segmentation |
| Ease of Use | Easy setup, non-technical friendly interface | More technical – developer-oriented, but highly customizable |
| Performance Impact | Lightweight script, but mobile performance varies | Wireframe Mode helps maintain app speed, especially on low-end or older mobile devices |
Microsoft Clarity vs. Google Analytics
In case you wonder, Google Analytics (GA4) is not really an alternative to Clarity. At this moment, both tools complement each other. GA4 provides a more quantitative perspective mostly appreciated by marketing specialists such as number of users, sessions, time on page, traffic sources, demographic data. Clarity helps you understand the “why” behind metrics that GA4 reveals with focus on actual user behavior valuable for UX-designer, QAs, developers.
Ideally, they should be used together in modern user behavior analytics – as long as your business is comfortable sharing data with both organizations: Microsoft and Google.
Data isn’t just for marketing specialists
Maybe some still believe that data analysis is mainly for marketing specialists and data analysts – but it should also be a key part of the software development process. Whether you're a developer, QA engineer, designer, or project manager, product decisions work best when they’re grounded in data. That’s the approach we take at Bright Inventions.
If you’re not getting meaningful feedback from your end users, we can help you find ways to gather insights without disrupting their experience. It’s something we already do, for example, when collecting feedback from POS system users.
Contact us to explore how we can support your solution!
